Converting Screenshots to Spreadsheets
I hate getting sent screenshots. I’ve written about this before.
I apprecaite that there are situations where it makes sense. For example, documentation (such as this post) include them to show how to use a software function. But, too often, I get sent a screenshot to share data–a table or report. From the point of view of a computer, a screenshot is a picture, same as a photo of my cat. While I can read numbers, I can’t copy them into a ticketting system so it can be processed, or put them into a spreadsheet to use them.
I would much rather be sent the actaul data–copy and pasting a table or sending me a spreadsehet rather than a picture of it. A lot of folks do the screenshot, though, because it’s quicker or doesn’t mess up the formatting (the latter being fair). There are some applications where copying and pasting the text has unexpected results, such as my company’s ticketing system.
I’ve come to accept that, somtimes, it can’t be avoided.
The good news is a lot of tools now have optical character recognition (OCR) built in. It can take a screenshot (or any picture of text) and extract the text into actual data. However, there are a few downsides. First, while contemporary OCR systems are very good, it still needs to be checked to ensure it interpeted the characters correctly. Also, how it arrange the data can present challenges–line breaks may not be where you want them, or there may be difficulty moving it where you need it. In particulare, it can be difficult moving a screenshot for a table into a spreadsheet.
A Pile of Screenshots
I was recently posed with such a challenge. I needed to compile some data from our ticketing system. The reports do not export to Excel, and copy-and-paste has very unpredictable results. When presenting them in a meeting, I resorted to screenshots. But, for a different presentation, I needed to take the current table, along with historical data from those presentations, and make a graph.
Each table in the screenshot had over 150 cells. It would be tedious to transcribe one, much less all the historical ones. I figured I could try the OCR to get the data out as lines of text, then use the Text to Columns feature of Excel to break it up.
I tried pasting a screenshot into OneNote, which I knew had some OCR capability. It actually could do it. It broke out the cells, but put them in one tall column–a lot of manual work would be needed to make it a table. I tested using the OCR in my personal iPhone, taking a picture of a table I made on my personal laptop. It worked, but, due to corporate restrictions, I couldn’t replicate it with my work setup.
I did a quick search, and found out that, for two years, Excel had my back. Pictures (and by extension, screenshots) could be used as a data source.
Data From Picture
The screenshot and explanation will be from Excel for MacOS. It works essentially the same way in Windows, though a few of the menu locations may not line up perfectly (the post that originally pointed this out to me is Windows specific). The spreadsheet used in this example, along with the screenshots, can be downloaded. I’ve put each on a tab, and will show the associated tab in this post.
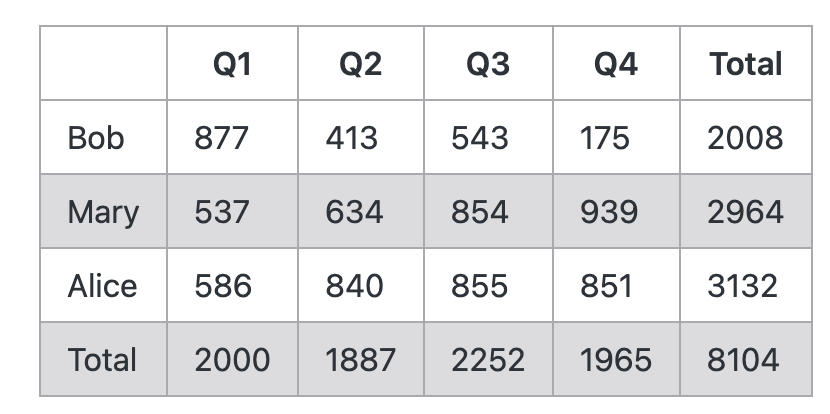
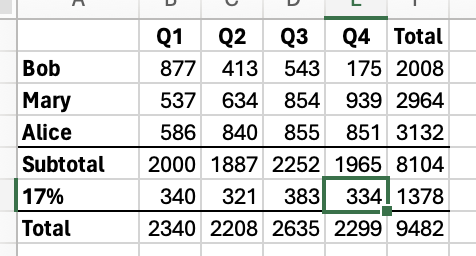
Start with a screenshot. The table below shows one I may have received. I can read the values, but I can’t, say, add 17% to each quarter’s total. This can be found in the Demo Screenshot of the example spreadsheet.
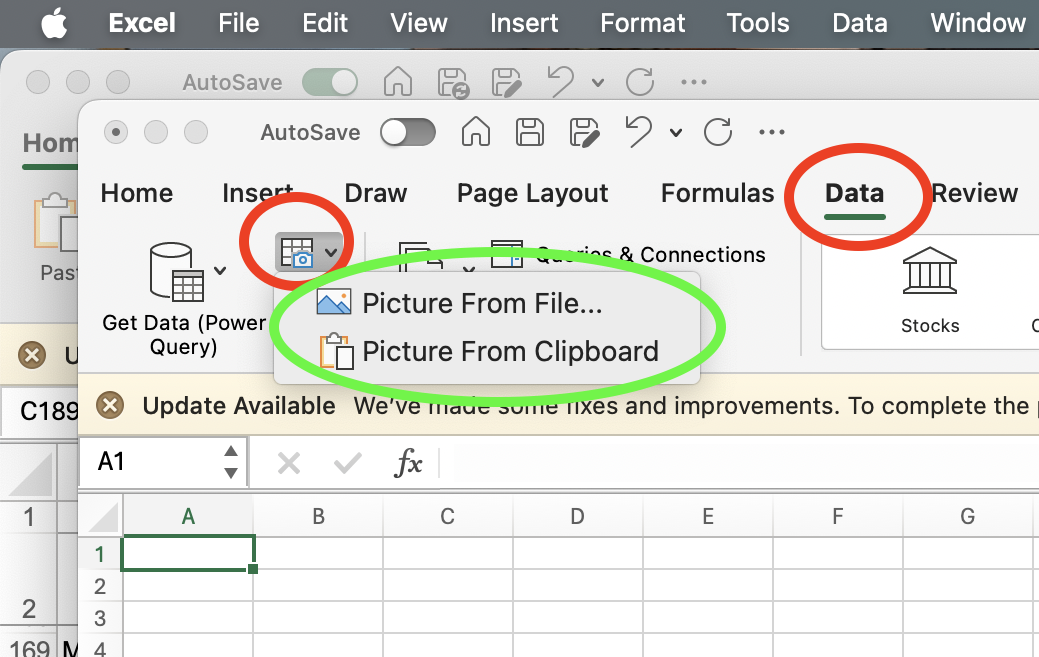
In Excel, go to the Data section of the ribbon, at the top. On the left, is an icon of a camera on a spreadsheet. You’ll get the option to select a Picture from file... (where you would be presented a dialog to navigate to a picture) or Picture from Clipboard. Click whichever is appropriate (and select your file).
(The exact location of the “Data from Picture” icon is the main difference between the Window sand Mac version. However, the Data section of the ribbon is where you’ll find it.)
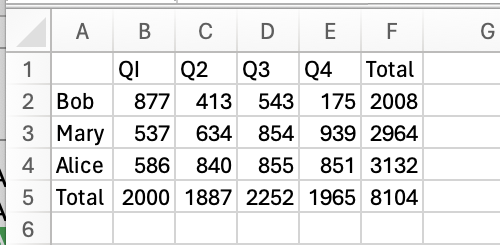
Excel will crunch for a moment, and give you the option to insert the data, or do some corrections. I just insert. You’ll get an initial import. It will be unformatted, and potentially have some errors where it intepreted the characters incorrectly. This can be see on the Fresh Import tab on the demo spreadsheet.
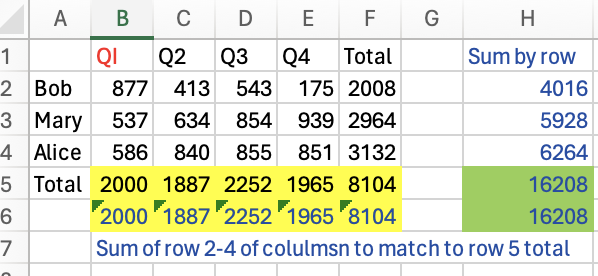
The next step is to correct the errors. Some of the text errors may stand out. For the actual data, I’ll run sums. I sum each row, then a sum of those sums. I do likewise for the columns. The two final results should match up. I also compare totals in the import to any total in the original. You can see this in the With Checks, comparing the green numbers. You can also look at the formuals.
Once I feel confident the data in the spreadsheet matches the data in the image, I can actually start doing work. I like for any cell that is a total actually have a SUM function. In this example, where I needed to do work with the data I add a row to calculate 17%, and a row for adding that to the original total. I’ll also add some formatting. This finished product is in the Formatted & Formulas tab.
Data on Paper
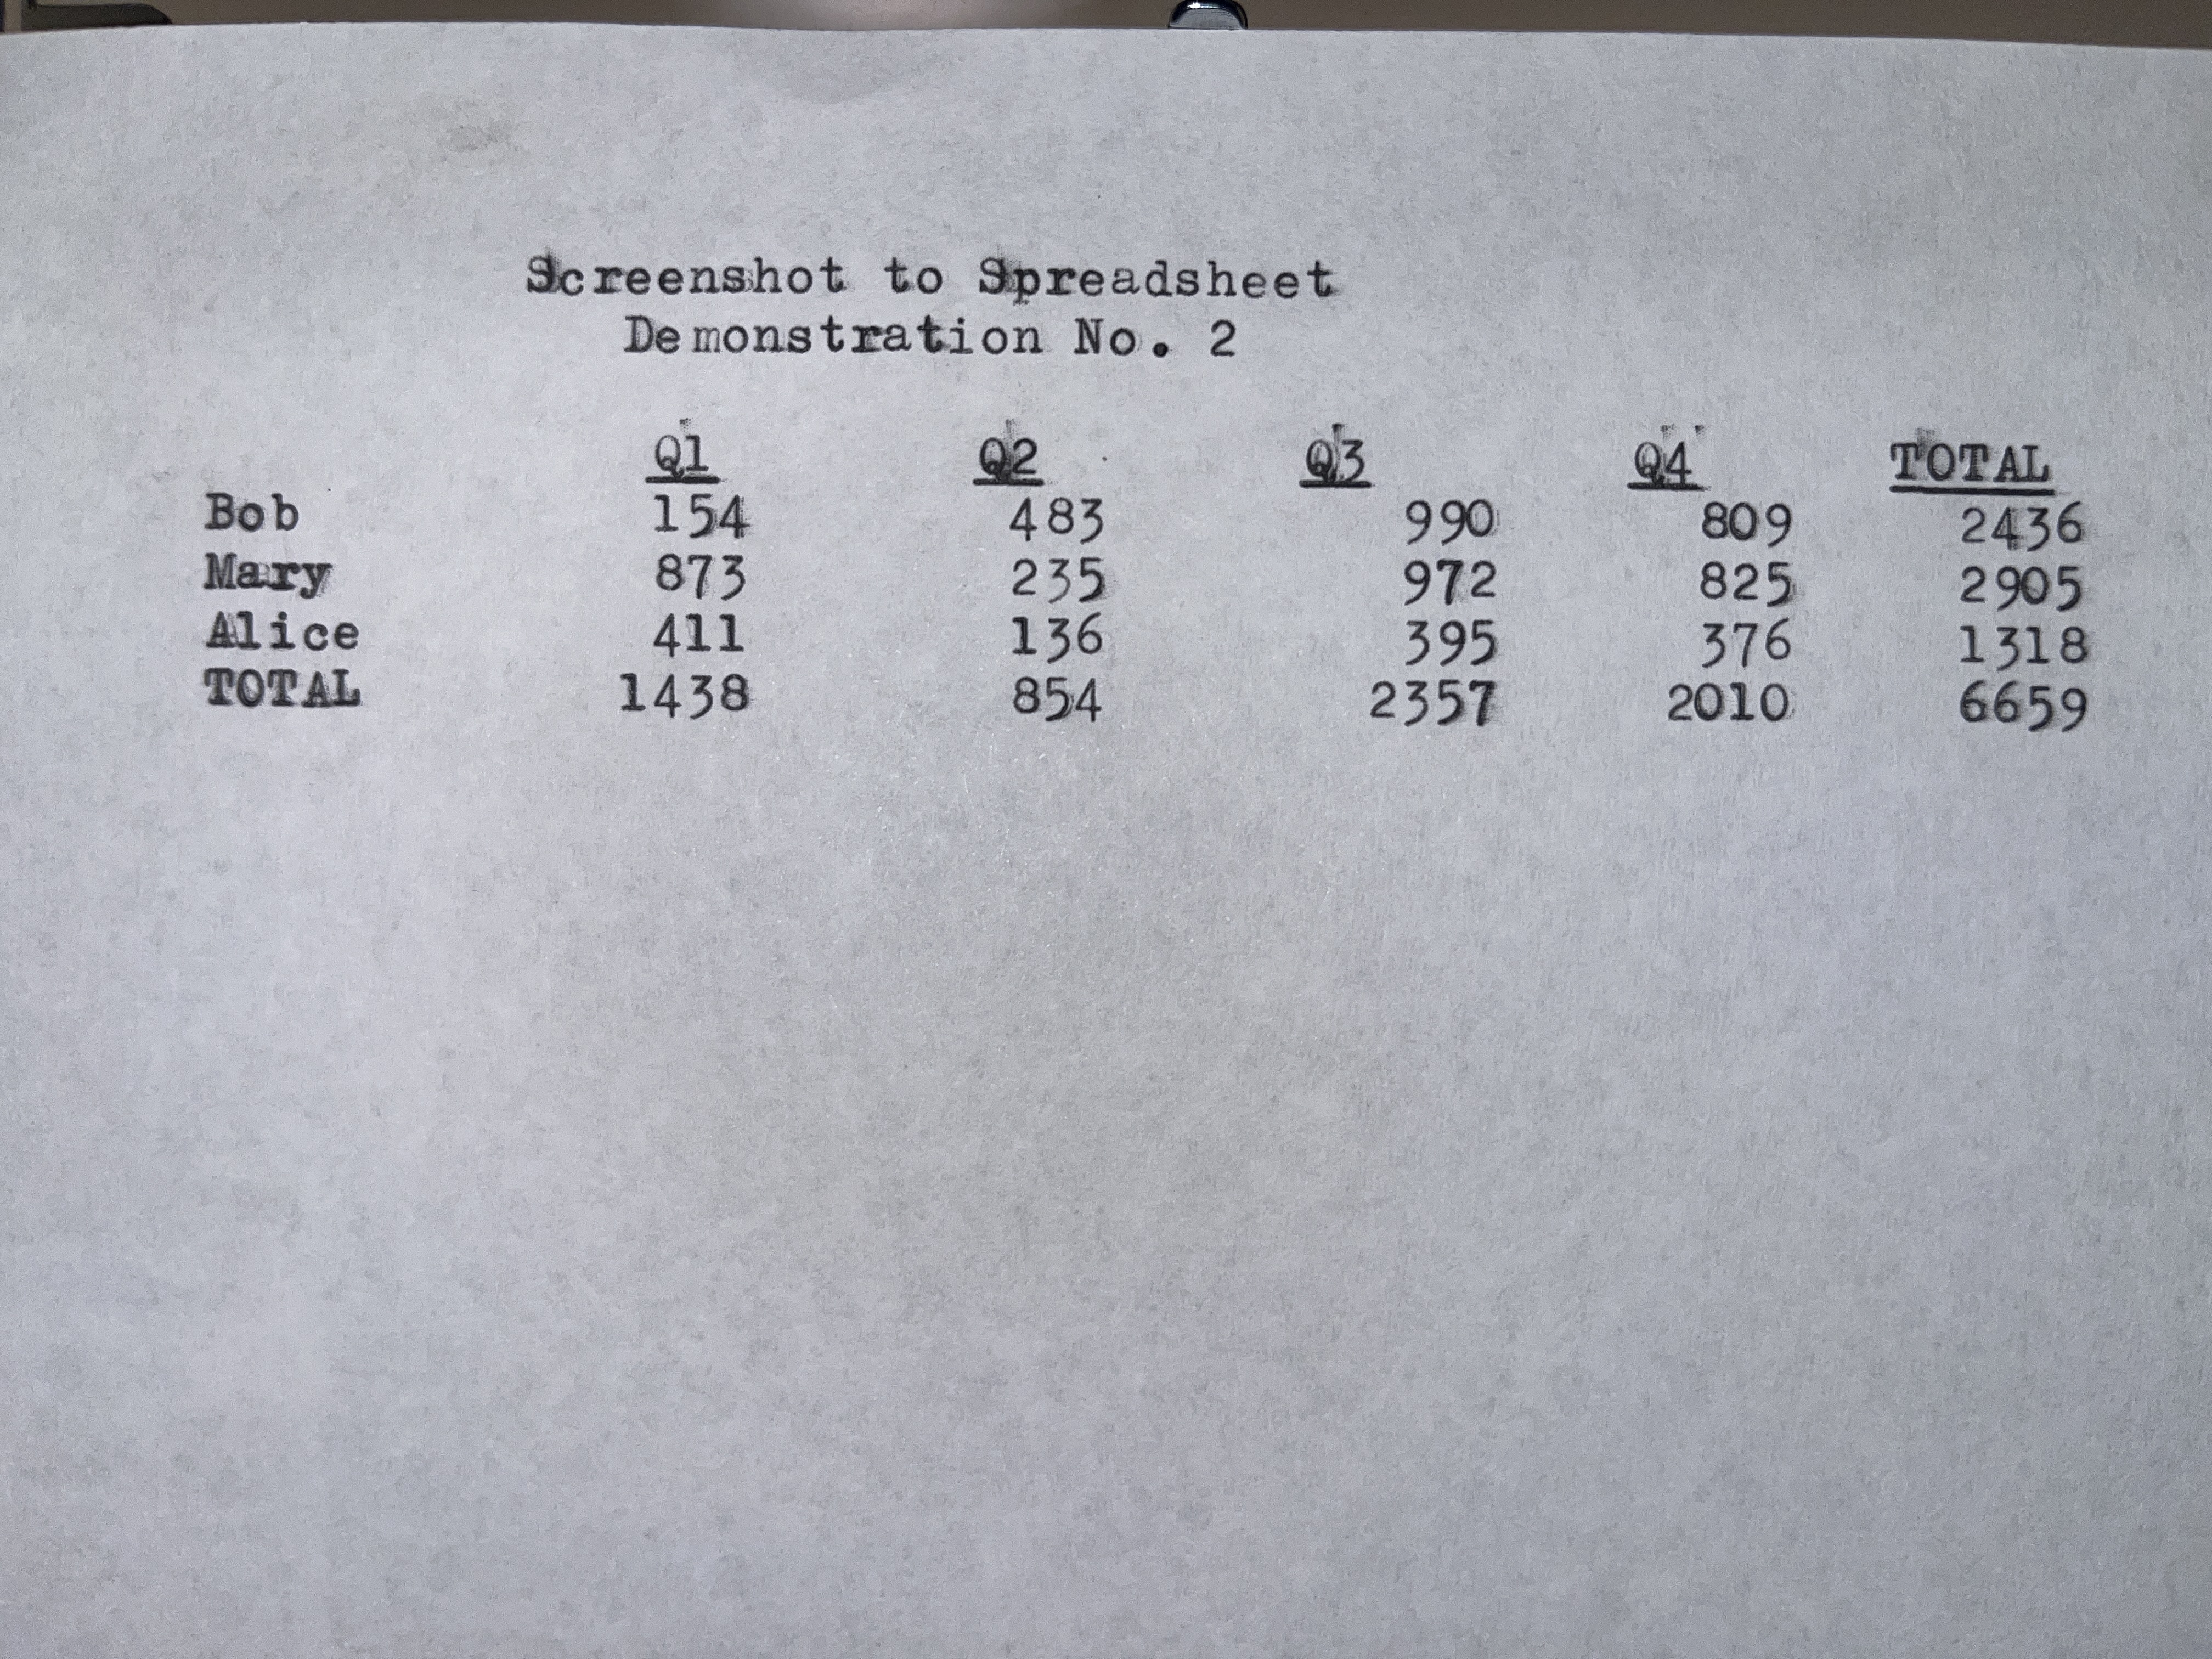
Actual screenshots, as I tend to get at work, is a relatively idealized case. The text is going to be clear, provided it’s of reasonable size and colors. But it’s easy to imagine wanting to take data from a book or paper, perhaps something not available online. As a retro-office-supply-geek, I decided to throw this a curve ball: I pulled out my vintage typewriter, and made a new table. I took a photo of this using my iPhone (which can also be seen in the Demo Image from Paper tab).
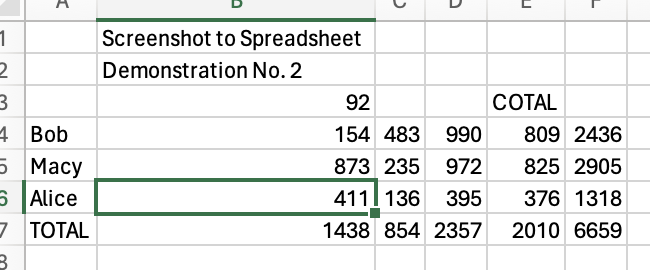
The initial import was not too bad, as you can see below (or in the Fresh Import (from Paper) tab). There are a few formatting things, and the column headers are messed up. But everything else was OK.
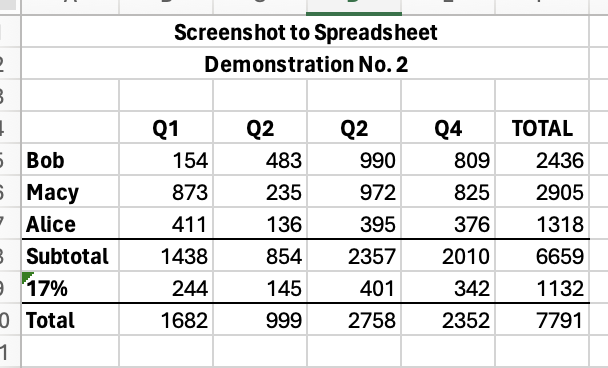
I ran some checks to ensure the data was correct, and fixed the titles and headers. I added the 17%, updated the formatting, and it looks great (the F&F (from Paper) tab)!
Learning to Love (or at Least Tolerate) Screenshots
For the three weeks after I learned about this, I walked around wanting to show everyone my New Favorite Thing. I demonstrated it to my partner (who has similar issues), and they were impressed. They asked if they had to let folks know they could do this (of course not!).
I still feel screenshots are overused, or somehow manage to be a lazy way to communicate information while also being overkill. Actual text data (to include source documents, like spreadsheets or word processing files) is always going to be the best way to share information. It will have a smaller footprint, and allow the data to be used in other contexts.
But I cannot deny their utility. Some systems simply do not lend themselves to selecting data and copying it. This feature in Excel has made this, if not seamless, then at least more tolerable. I am very happy to have added this to my toolbox.
OCR Tools
As mentioned earlier, I considered a few other OCR tools at my disposal. Each had their quirks, but certainly have utility. OCR has come a long way since I first encountered it, moving from somthing that took a lot of time and effort, to something quick and fairly reliable. The amount of manual correction has reduced dramatically. While the original use case of OCR was paper scanned on a dedicated piece of equipment, situations where it is useful is more commonplace. Instead of scanning a piece of paper or a sign, I can take a photo of it with my phone. Screenshots are, for all intents and purposes, the same thing.
Use of analog tools in modern work is one of the focuses of this blog. It seems obvious that such atoms-to-bits conversions would be in my scope. Expect more explantions and reviews of OCR in the future.
There are currently no comments on this article, be the first to add one below
Add a Comment
Note that I may remove comments for any reason, so try to be civil. If you are looking for a response to your comment, either leave your email address or check back on this page periodically.